Introduction
Bladder urothelial cancer (UC) is characterized by a spectrum of presentations requiring frequent follow-up and intensive treatments. It is highly prevalent at greater than 500,000 people in the US and is the most expensive cancer in the United States to treat due to the need for constant lifelong monitoring. The initial presentation of bladder UC can be relatively benign with urinary frequency and dysuria which may at times be underappreciated. The diagnosis of bladder UC in many cases requires a visit to a physician, a referral to a urologist, and workup including urine cytology, CT scan, and a cystoscopy. In cases of superficial disease, careful follow-up can lead to effective control whereas poor follow-up can lead to progression and significant morbidity and mortality. For invasive disease, a timely presentation and initial evaluation, as well as a multidisciplinary approach, is often important for the effective treatment of the disease.
Utilization of the healthcare system has been associated with socioeconomic status (SES) [
1]. As such, bladder UC may be a disease where there is an association of socioeconomic status and outcomes. There is an increasing body of knowledge that has highlighted the association of poorer outcomes with socioeconomic status and increased mortality from various cancers [
2,
3]. In bladder UC, several studies have shown some form of survival disparity from bladder UC associated with SES [
1,
4-
10]. Most of these studies had the primary endpoint of all-cause mortality, a measure that may be associated with SES regardless of the diagnosis of bladder cancer. One study has shown bladder UC specific survival but with the shortcoming that this association was shown without the ability to control for significant confounders such as comorbidity [
9]. Health insurance has been utilized as a proxy for SES in multiple studies that examine the association of various disease outcomes to SES [
1,
11,
12]. The strength of this measure is that particularly for lower SES-associated health insurance plans, an individual review of income is performed on each patient to justify the taxpayer subsidy that often accompanies inclusion in the plan. In this study, we further examine if there is an association between bladder UC outcomes and health insurance source.
Materials and Methods
The Institutional Review Board approved this retrospective cohort study. Billing records were reviewed for procedures performed in the years 2004 and 2005 at the Massachusetts General Hospital (MGH). All procedures listed as transurethral resection of bladder tumor (TURBT) or cystoscopy and bladder biopsy were examined. The Electronic Medical Record (EMR) was investigated and all patients who had a new diagnosis of bladder cancer in 2004 and 2005 were selected for inclusion in this study. This time frame offered a convenient time frame where the electronic medical record was fully implemented and reliable data could be gathered, and yet was before the implementation of the Massachusetts health care reform. A total of 225 patients were identified, of whom six were excluded being lost to follow-up within 6 months (with no death within that year) and six were excluded due to unclear insurance records (Medicare part A coverage with unclear part B coverage source). In the remaining 213 patients, clinic notes, pathology, operative, and radiology reports, laboratory records, and demographic information were reviewed. Insurance information was obtained from the billing records. Occurrences and dates of death were confirmed through the National Social Security Death Index (SSDI, http://www.genealogybank.com). Records were reviewed from January 2004 through September 2014.
The decision to stratify into low and high socio-economic status was made a-priori due to the individualized income assessment performed by insurance plans in the process of acceptance into publically subsidized plans. Insurance plans that are based on income level cutoffs, such as Medicaid and Massachusetts Free Care, were characterized as lower SES-associated plans. We grouped patients who had purchased supplemental Medigap or Medicare Advantage plans as high SES-associated plans and those who had not purchased supplemental coverage as lower SES-associated plans [
11-
14]. Median zip code income and local poverty level was determined by search of the individual zip code of residence in the 2000 US census [
15,
16] and used to confirm the association of SES measures with the insurance plan groups.
The pathologic report from each patient’s initial TURBT was used to record presenting tumor stage and grade. Dedicated genitourinary pathologists at MGH evaluated all specimens including tissue from outside institutions. Death in all patients, even in those lost to follow-up, was checked in the SSDI. UC specific mortality was determined by reviewing EMR notes in a fashion blinded to insurance group. Death was attributed to UC when the cause of death was easily attributable as most likely potentiated by the UC (such as massive pulmonary embolism) or death from a complication of treatment for UC (such as perioperative death for cystectomy. In cases where death occurred greater than 2 years after the last known follow-up, the death was assumed to be due to causes other than urothelial cancer. The date of death was used as last follow-up in the calculation of overall mortality. Follow-up was calculated on patients that were not deceased within the study period.
Table 1. Patient population characteristics.
|
|
|
|
|
| # of patients |
174 (82%) |
39 (18%) |
|
| Gender |
|
|
0.3 |
| Male |
72% |
64% |
|
| Female |
28% |
36% |
|
| Age at diagnosis (yrs) |
68.1 |
69.2 |
0.6 |
| Smoking Hx |
74% |
78% |
0.6 |
| Charlson comorbidity index |
0.7 |
1.3 |
0.04 |
| Mean follow-up (months) |
89.7 |
63.2 |
0.01 |
| Lost to follow-up |
5.3% |
6.2% |
1.0 |
| Marital Status |
|
|
0.008 |
| Single |
12% |
28% |
|
| Married |
66% |
38% |
|
| Divorced |
7% |
15% |
|
| Widowed |
14% |
18% |
|
| Education |
|
|
0.02 |
| Some High School |
8% |
26% |
|
| High School Graduate |
24% |
32% |
|
| Vocational / Some College |
13% |
21% |
|
| College Graduate |
55% |
21% |
|
| Presenting referral source |
|
|
0.01 |
| Primary care physician |
65% |
48% |
|
| Emergency department |
7% |
30% |
|
| Other |
27% |
22% |
|
| Census data for zipcode of residence |
|
|
|
| Mean income |
$58,052 |
$49,419 |
0.002 |
| % under poverty |
8.6% |
11.6% |
0.01 |
Statistics was calculated using SAS JMP 8.0.2 (Cary, NC). For comparisons of characteristics between the high and lower SES-associated insurance groups, statistical inference was made using chi-square analysis for categorical variables and ANOVA for continuous variables. For survival analysis, Kaplan-Meier time-to-event analyses were used for evaluation of SES and for calculation of one and five-year mortality. Univariate and multivariate analyses were performed using the Cox proportional hazards model and log-rank statistics. Cancer stage and grade were examined as categorical variables. Multivariate analysis was performed including any factors with P < 0.15 on univariate analysis using the Cox regression models.
Results
Overall, 213 patients with newly diagnosed bladder UC in 2004 and 2005 were examined. The mean follow-up was 84 months. The median age at presentation was 69 years and 70% were male. High SES-associated insurance patients comprised 82% of the total. Complete characterizations of the study groups are outlined in Table 1. There were no significant differences between gender, age, or history of smoking by insurance group. Smoking history was available for 77% of patients and pack-year history was available for 52%. For those who had a history of smoking, both groups had similar pack-years history of smoking (median 40 pack-year history for both). The Charlson comorbidity index score was 0.7 and 1.3 (P = 0.04) in the high and lower SES-associated insurance groups respectively.
Table 2. Disease presentation and treatment characteristics.
|
|
|
|
|
| Presenting Tumor Grade |
|
|
0.9 |
| Low Grade |
40% |
41% |
|
| High Grade |
60% |
59% |
|
| Presenting Tumor Stage |
|
|
0.1 |
| pTa |
46% |
44% |
|
| pTis |
7% |
0% |
|
| pT1 |
20% |
23% |
|
| pT2+ |
26% |
33% |
|
| Metastatic on presentation |
4% |
5% |
0.8 |
| Cystectomy |
|
|
|
| |
18% |
21% |
0.8 |
| Chemoradiation bladder sparing |
|
|
|
| |
16% |
13% |
0.6 |
| BCG |
|
|
|
| |
30% |
13% |
0.02 |
As validation of SES association with the two insurance groups, we examined some additional commonly utilized factors to confirm that the two groups had demographics indicative of high vs. lower SES. College education was more common among patients characterized by high SES-associated insurance at 55% compared to 21% of those with lower SES-associated insurance (P = 0.02). Marital status also differed between the two groups in that 66% of high SES insurance subjects were married vs. 38% in the lower SES insurance group (P < 0.01). Patients presented more commonly through their primary care doctor in the high SES group (65% vs. 48%, P = 0.01) and lower SES group presented more commonly for the first time in the emergency department (7% high SES vs. 30% lower SES, P = 0.01).
We also examined the demographics based on the 2000 US Census of the zip code of residence, a commonly used proxy in other studies for SES. The median income in the zip code of residence for the high SES-associated insurance group was $58,052 and for the lower SES was $49,419 (P < 0.01). The percentage below poverty level was 8.6% for the high SES and 11.6% for the lower SES groups (P = 0.01). All of these characteristics of the two populations acted to validate the association of these two insurance groups with high and lower SES.
The presenting stage and grade of the tumor in the two groups was similar (Table 2). Their was no statistically significant difference in percentage of subjects with TNM stage T2 or greater tumors (26% in the high SES insurance group, 33% in the lower SES insurance group, P = 0.1), high-grade UC (60% vs. 59% in the high and lower SES insurance groups, P = 0.9), and prevalence of metastatic disease at presentation (4% high vs. 5% lower SES-associated insurance, P = 0.8). The only significant difference between high and lower SES insurance groups in regards to disease presentation was the presence of CIS (7% high SES vs. 0% lower SES, P = 0.02).
Table 3. Overall and disease specific mortality.
|
|
|
|
|
| One-year mortality |
|
|
|
| All-cause |
6% |
28% |
0.002 |
| UC specific |
5% |
21% |
0.003 |
| Five-year mortality |
|
|
|
| All-cause |
28% |
54% |
0.002 |
| UC specific |
19% |
42% |
0.007 |
Treatment modalities utilized were also similar between the two groups (Table 2). Cystectomy was performed with similar frequency in high vs. lower SES insurance patients (18% vs. 21%, P = 0.8). Both populations were enrolled into the multi-modal therapy (maximal TURBT, plus chemotherapy and radiation) bladder sparing protocol at equal rates as well (16% high SES vs. 13% lower SES insurance groups). Time to cystectomy for patients presenting with stage ≥ T2 disease was also similar for high vs. lower SES insurance groups (3.2 months vs. 4.7 months, P = 0.5). BCG was used more often in the high SES insurance population (30% vs. 13%, P = 0.02), likely due to the increased occurrence of CIS in this population. When controlled for grade and stage, there was no statistically significant difference in relative risk of BCG treatment between the two groups.
All cause and disease specific mortality outcomes were statistically different between the two groups. The one-year overall mortality was significantly lower in the high SES insurance group than in the lower SES insurance group (6% vs. 28%, P = 0.002) as was disease specific one-year mortality (5% vs. 21%, P = 0.003). Similarly, the five-year overall mortality was significantly lower in the high SES group than in the lower SES-associated insurance group (28% vs. 54%, P < 0.002), as was disease specific five-year mortality (19% vs. 42%, P = 0.007) (Table 3). Kaplan-Meier analysis demonstrated a significant difference in disease specific mortality that persisted throughout the duration of the follow-up (Fig. 1). Of note, when stratified for muscle invasive vs. non-muscle invasive disease, there was no association with SES and survival in non-muscle invasive disease and the entirety of the disparity was observed amongst the muscle-invasive bladder cancer cohort.
We investigated risk factors for disease specific mortality. Upon univariate Cox regression analysis, Charlson comorbidity index, high-grade disease, higher stage disease, metastatic disease on presentation and lower SES-associated insurance were all significant risk factors of increased mortality. Age, gender, marital status, referral source, education, median income, smoking history, history of bladder sparing chemoradiation or BCG were not significant risk factors. Upon multivariate analysis controlling for age, gender, Charlson comorbidity index, grade, stage, and metastatic disease, insurance group remained as a significant risk factor for increased mortality (Table 4).
Table 4. Risk factors for death from bladder urothelial carcinoma.
|
|
|
|
|
|
|
|
|
|
| Age (per yr) |
1.02 |
1.00–1.05 |
0.07 |
|
1.0 |
0.98–1.04 |
0.6 |
| Gender (M) |
0.6 |
0.3–1.1 |
0.1 |
|
0.8 |
0.4–1.7 |
0.6 |
| Smoking history |
1.4 |
0.7–3.2 |
0.4 |
|
|
|
|
| Marital status (Married / Single) |
0.6 |
0.3–1.4 |
0.2 |
|
|
|
|
| Education (College/HS) |
0.7 |
0.2–2.7 |
0.6 |
|
|
|
|
| Referral source (PCP/ED) |
0.9 |
0.3–2.8 |
0.7 |
|
|
|
|
| Median income (over entire range) |
0.6 |
0.07–4.6 |
0.7 |
|
|
|
|
| Charlson Comorbidity (per unit increase) |
1.2 |
1.0–1.5 |
0.04 |
|
1.3 |
1.1–1.7 |
0.02 |
| High grade |
6.4 |
2.9–16.7 |
< 0.0001 |
|
3.0 |
1.2–9.0 |
0.02 |
| Stage T2+ / Ta |
8.1 |
3.7–19.3 |
< 0.0001 |
|
2.7 |
0.8–6.4 |
0.06 |
| Stage T2+ / T1 |
3.7 |
1.1–23.5 |
< 0.0001 |
|
|
|
|
| Mets on presentation |
32.3 |
13.7–70.0 |
< 0.0001 |
|
16.6 |
6.3–42.6 |
< 0.0001 |
| Lower SES insurance |
2.7 |
1.4–4.8 |
0.003 |
|
2.6 |
1.3–5.0 |
< 0.01 |
Discussion
This study demonstrates that lower SES-associated insurance is an independent risk factor for increased mortality from UC of the bladder, even when controlling for disease characteristics and competing patient factors for mortality. The etiology of the association of lower SES-associated health insurance plan enrollment with UC mortality could be related to a host of factors including access to healthcare, treatment, and the effect of associated other socioeconomic factors. Prior researchers in the area of SES and cancer survival have postulated that reduced survival of patients of lower SES may be associated with delayed presentation, reduced access to healthcare, disease biology, environmental factors, tobacco exposure, and health habits [
17]. Our study did not demonstrate a difference in grade or stage of disease presentation. Tobacco usage also did not seem to differ between insurance groups. We observed that the lower SES insurance group tended to present initially through the emergency room much more frequently than the high SES group. This raises the concern that this population is not well connected with the healthcare system prior to their diagnosis. Whether this is due to influence of the insurance coverage vs. other factors such as self-care habits warrants further study. Additionally, a greater proportion of patients had CIS in the high SES insurance group which could point towards differences in disease biology.
To assess if there was any effect due to differential treatment of the high and lower SES-associated insurance groups, we investigated the therapeutic modalities utilized to treat these two groups as well as time to cystectomy. We found that patients in either of the two groups of insurance plans received equivalent quality of care. It is our belief that health insurance in this cohort did not reflect variation in the quality of care. Roughly the same proportion of the two groups had a cystectomy or underwent chemoradiation for bladder sparing approach. There was a significant difference in BCG utilization, likely influenced by difference in CIS prevalence; however in a separate analysis BCG did not affect overall survival and cancer specific survival. This equivalence in care is in contrast to some other studies which examine the relationship of insurance and SES with UC outcomes, however those studies were based on reviews of large cancer registries where a variety of communities were included [
14]. The fact that all patients saw the same physicians at the same institution and had the same resources available may have controlled for the potential variability of therapy. The insurance types did reflect variation in education, marital status, site of presentation, and median income in area of residence. What did vary between these two groups were the Charlson comorbidity status and the initial setting in which the patients presented with symptoms. Low SES patients were more likely to have more comorbidities, and more likely to present through the emergency department vs. high SES who more consistently presented through a primary care doctor. In such low SES patients with poor history of regular checkups, the disparity in comorbidity score may actually be underestimated due to unrecognized medical conditions.
Despite equivalent grade and stage at presentation and equivalent treatment, patients with lower SES-associated insurance had significantly worse cancer specific mortality. The lower SES insurance group had a 16% worse one-year mortality than the high SES insurance group and a 23% worse five-year mortality. The majority of the difference seemed to occur in the first six months of diagnosis. This time period could become an area of further improvement in efforts to narrow the disease specific mortality gap between these two groups. Although a statistically significant difference in ≥ T2 disease was not seen, there was an absolute difference of 7% that perhaps with greater power may have become statistically significant. However, multivariate analysis controlling for stage demonstrates that delayed presentation leading to higher stage does not fully explain the survival disparity.
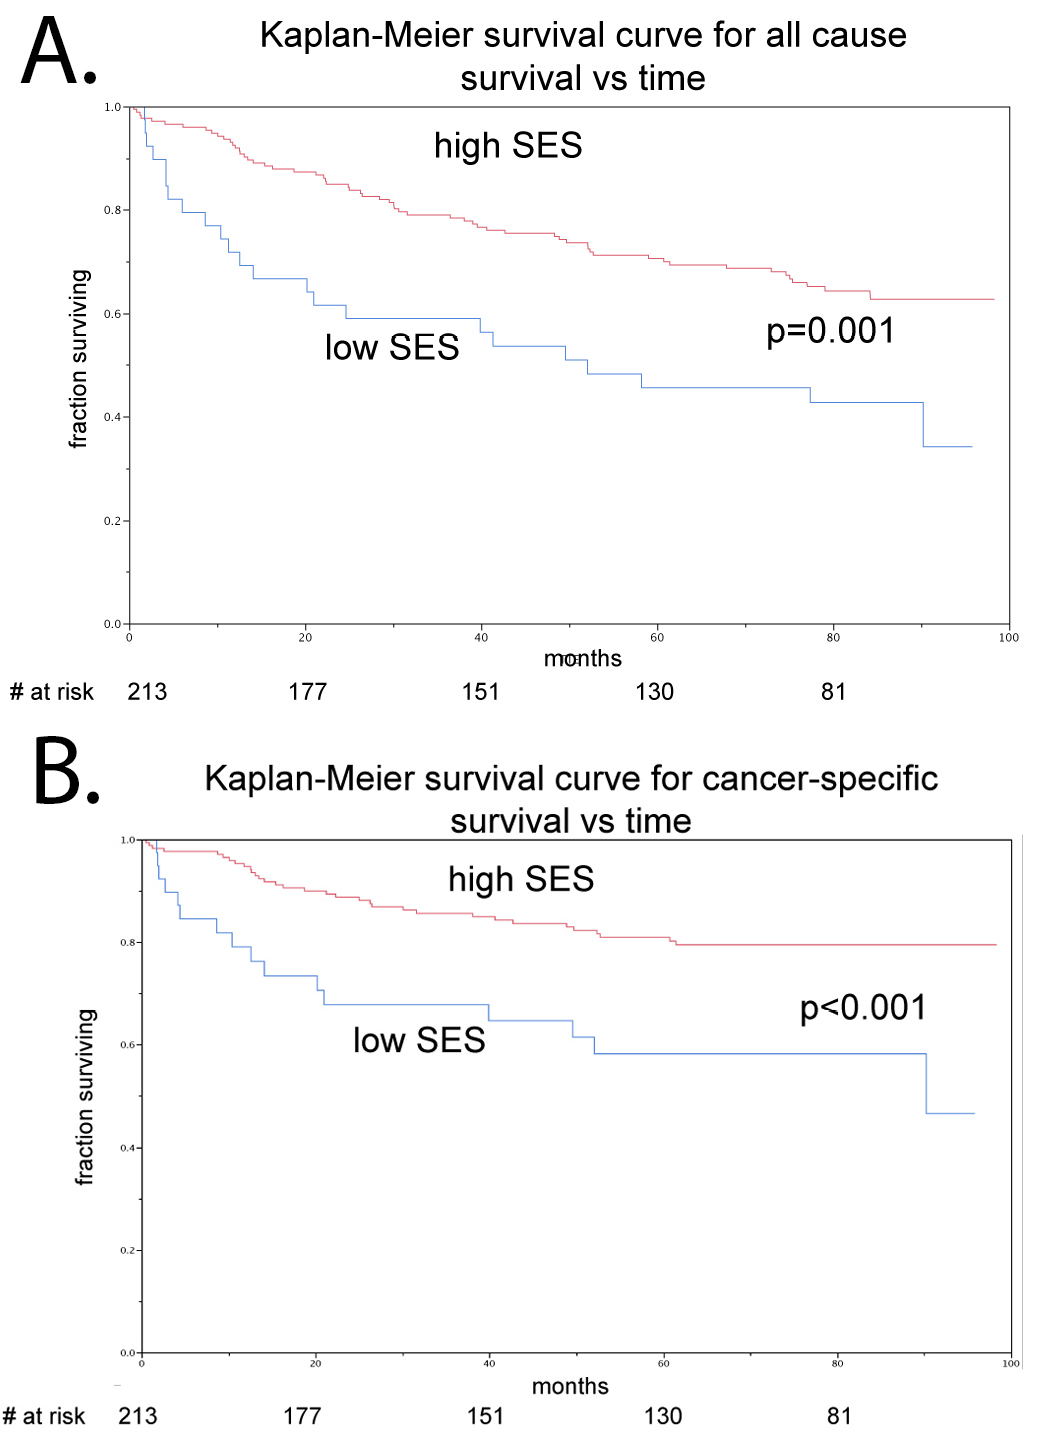
Figure 1. Kaplan-Meier survival curves stratified by socio-economic status. A. All-cause mortality was significantly greater in the low socio-economic group compared to the high socio-economic group (P < 0.001). B. Bladder cancer-specific mortality was significantly greater in the low low-socioeconomic group compared to the high socio-economic group (P < 0.001).
This study highlights the need for further research in the interplay of healthcare insurance, socioeconomic disparity and mortality from bladder cancer. Lower SES-associated health insurance was an independent predictor of poorer outcome even when age, stage of presentation, and grade of presentation were controlled for. Further investigation in a larger cohort might explain why the prognosis is poor in the early part of treatment. This could result in the development of public health policy changes that could improve outcomes in the lower SES insurance cohort.
The limitations of this study include that it is based on the patient population of one institution. Further work is necessary to test if similar patterns exist in wider populations. Furthermore there is potential for bias in utilization of insurance source to differentiate the high and lower SES groups. Although publicly funded insurance is likely to be a good predictor of lower SES due to a requirement of income review and proven low income for enrollment, private insurance is likely a mixture of low and high SES patients. As such, the groupings are not perfectly associated with SES. Lastly, a limitation was that this institution’s hospital records in 2004 and 2005 did not have a reliable record of race, and as such race could not be included in the analysis. Future studies that will be of particular interest in the state of Massachusetts will be to examine the effects of the Massachusetts health care reform law of 2006. Such data with 5-year follow-up should be available regarding the 2008 and 2009 cohort (the first years the law was fully in effect) in a few years.
Conclusions
We observed significant disparities in survival associated with source of insurance for patients with bladder cancer. An increased risk for early mortality amongst lower SES-associated health insurance patients was also seen. Our findings support the need for further investigation as to why lower SES insurance patients have an increased mortality in comparison to high SES insurance patients and also into other factors that seem to continue to impact a widening disparity in survival seen at the five-year follow-up.